Simple Surveys and Great Graphs
Students create and complete surveys, graph the data, and share the results with an audience outside the classroom.

Task
In this age of overwhelming amounts of information, data is playing a larger and larger role in our culture. While young students may not be having sophisticated conversations about data yet, they are hearing statistics and numbers on television, radio, and adult conversations.
In this lesson, students work in small teams to choose a question and survey their classmates to collect data. Then, the teams create bar graphs of the data, analyze the results, and share their findings with an audience that can use the information.
Engage
Young students are just beginning to learn to read, and may not be ready to read to learn. That doesn’t mean that they don’t need to think about information or can’t work with it.
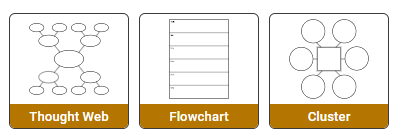
A bar graph is a simple way to present data to someone in a way that makes it easy to understand. Teaching young students how to create and read a graph gets them thinking about information now and builds a foundation for future understanding of more complex data.
Show your students examples of graphs that you have found in the world outside of your classroom. For example, USA Today regularly shares data in visual form through their Snapshots.
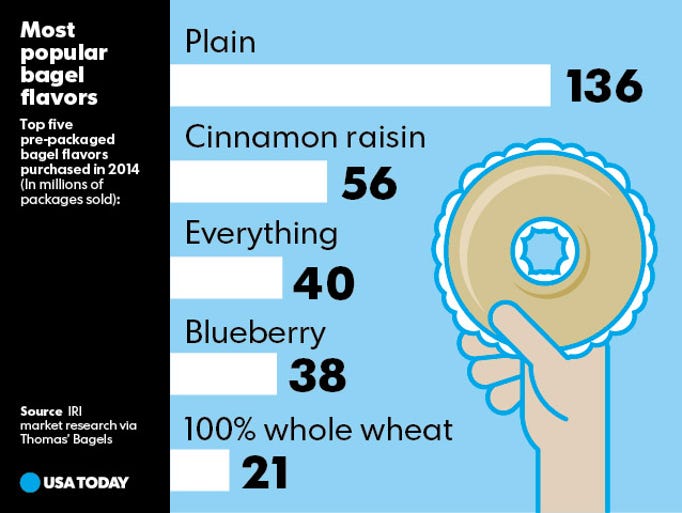
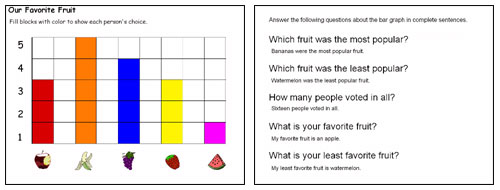
Explore an example of a bar graph like the one above. See if students can already “read” it and answer questions like:
- What is this graph about?
- Which is the most popular option?
- Which is the least popular option?
- Who would care about this information?
The last question is more difficult because the answer is not in the graph. If students can see how the owner of a bagel shop could use this information to order the right type of bagels in the right amounts for their customers, you help them make connections between what they are learning in the classroom and the world beyond it.
Next, introduce your students to the concept of a survey. Read a story like Tally O’Malley by Stuart J. Murphy to get students thinking about using tally marks to collect data.
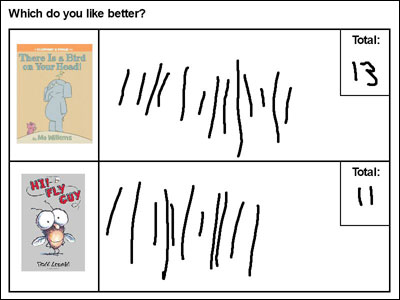
Create a two- or three-option survey and have students come up individually to make their tally mark. Younger students can make a simple tally mark, but older students should make a diagonal tally mark to show groups of five.
You can easily create this survey using a digital tool like Wixie. Then you can open it on an interactive white board and when students come into class have them make a tally mark as a bell ringer activity.
Take the information from the survey you created and show students how to create a bar chart to show the information. You can use chart paper with grid lines or create one from a template in Wixie.
As you look at the bar chart and discuss the results of your survey, connect the data in it to an audience that would benefit from the information. For example, a bar chart created from the survey above would quickly show a Kindergarten teacher which book would be a good choice to buy next for their classroom library.
Create
Let students know that they will be working in small teams to create their own survey and collect data they will display in a bar graph.
To make the project more engaging, let the students collect data about something they want to know. For example: Which flavor of ice cream do students like the most - vanilla, chocolate, or strawberry? or What kind of class pet should your teacher get for your room?
You might want to share some ideas with your students. Depending on the age of your students you can suggest ideas with two, three (CCSS 1st grade), or four (CCSS 2nd Grade) options, such as:
- Do you want to visit the moon? (yes or no)
- Who will win the game this weekend? (names of two sports teams)
- What is your favorite school subject? (reading, math, or science)
- What type of pet do you have? (dog, cat, fish, other)
Ask students to come up with some of their own ideas and create a list everyone can see. Choose students to be your team leaders and ask them to be the first to select a topic they want to survey. Then, have other students form teams of 3-4 students around each topic chosen.
If you want to make real world connections, you might focus their questions around food. This way the data can be used to help the cafeteria make decisions or a parent choose the right food for a birthday party. For example:
- What is your favorite fruit?
- What is your favorite lunch meal?
- Do you prefer ice cream or a cookie for dessert?
- Do you drink milk, water, juice with your lunch?
After teams have chosen a topic or question they want to ask, have them create a survey they can use to collect data in the form of tally marks. Next, have them collect data from each student in the class.
While students should create and collect survey data as a team, have individual team members each create a bar graph to display the data. This will make it easier to assess individual understanding.
Share
Once individual graphs are complete, have each student print their bar graph and share it with the rest of their group. Have students work together to explore each of their graphs and ask and answer questions about the data similar to those you asked in the initial graph discussion.
Have teams present what they think is their best graph to an outside audience, sharing their findings and the recommendations they have for actions they should take based on the information displayed in the bar graph. For example, if a team surveyed most popular fruits, they could share their bar graph with cafeteria staff to help them make decisions about which fruits are likely to be most popular in school lunches. If a team surveyed students about favorite playground activities, they could share the data with the principal and parent association as they consider new playground equipment to purchase, update, or replace.
Assessment
In this project, you are evaluating student understanding of why to use a survey, how to create one, and how to collect survey data. You are also evaluating student’s ability to create a bar graph that represents the data they collect and interpret the data on the graph.
Creating a tally mark survey is perhaps the easiest. Even in Kindergarten, students understand one-to-one correspondence, so creating a mark for each piece of data should be easy for most students. Attention to detail and clear headings that organize the data will more likely be places you need to evaluate student comprehension.
Depending on the age and ability of your students, you may have created many of the necessary features of their graphs for them. Even if you have added in the title, labels for the axes, and images to represent the options surveyed or used grid lines or graph paper to create a consistent scale, be sure to discuss the need for each of these elements to help the viewer more clearly understand the information.
You may want to create a _______ (blank) space in the position of the title and axis labels so that students have to do more work and think more deeply about what the graphs is supposed to be about and what information is being shown.
As students are sharing their graphs with a partner, listen to their discussions to get a sense of their understanding. You might want to provide them with prompts like: ”Which option had the most responses?” but they will internalize more deeply if they have to work to come up with their own questions.
If students have worked in small teams to create a graph together, take time to prepare the questions as a group to challenge another group. Then, pair with that group for questions and answers.
Resources
Stuart J. Murphy. Tally O’Malley.. ISBN: 0060531649
BrainPOP: Tally Charts and Bar Graphs
Standards
Common Core State Standards for Math:
CCSS.MATH.CONTENT.1.MD.C.4
Organize, represent, and interpret data with up to three categories; ask and answer questions about the total number of data points, how many in each category, and how many more or less are in one category than in another.
CCSS.MATH.CONTENT.K.G.A.2.
Correctly name shapes regardless of their orientations or overall size.
CCSS.MATH.CONTENT.2.MD.D.10
Draw a picture graph and a bar graph (with single-unit scale) to represent a data set with up to four categories. Solve simple put-together, take-apart, and compare problems1using information presented in a bar graph.
ISTE NETS for Students 2016:
3. Knowledge Constructor
Students critically curate a variety of resources using digital tools to construct knowledge, produce creative artifacts and make meaningful learning experiences for themselves and others. Students:
d. build knowledge by actively exploring real-world issues and problems, developing ideas and theories and pursuing answers and solutions.
6. Creative Communicator
Students communicate clearly and express themselves creatively for a variety of purposes using the platforms, tools, styles, formats and digital media appropriate to their goals. Students:
d. publish or present content that customizes the message and medium for their intended audiences.